app.photog.ai
Enter the password to view this case study.
Four AI agents, one marketing platform — and most users left before publishing a single post. I redesigned the system's trust architecture, introducing intentional friction, progressive disclosure, and human-in-the-loop gates that turned autonomous AI into a collaborative tool.
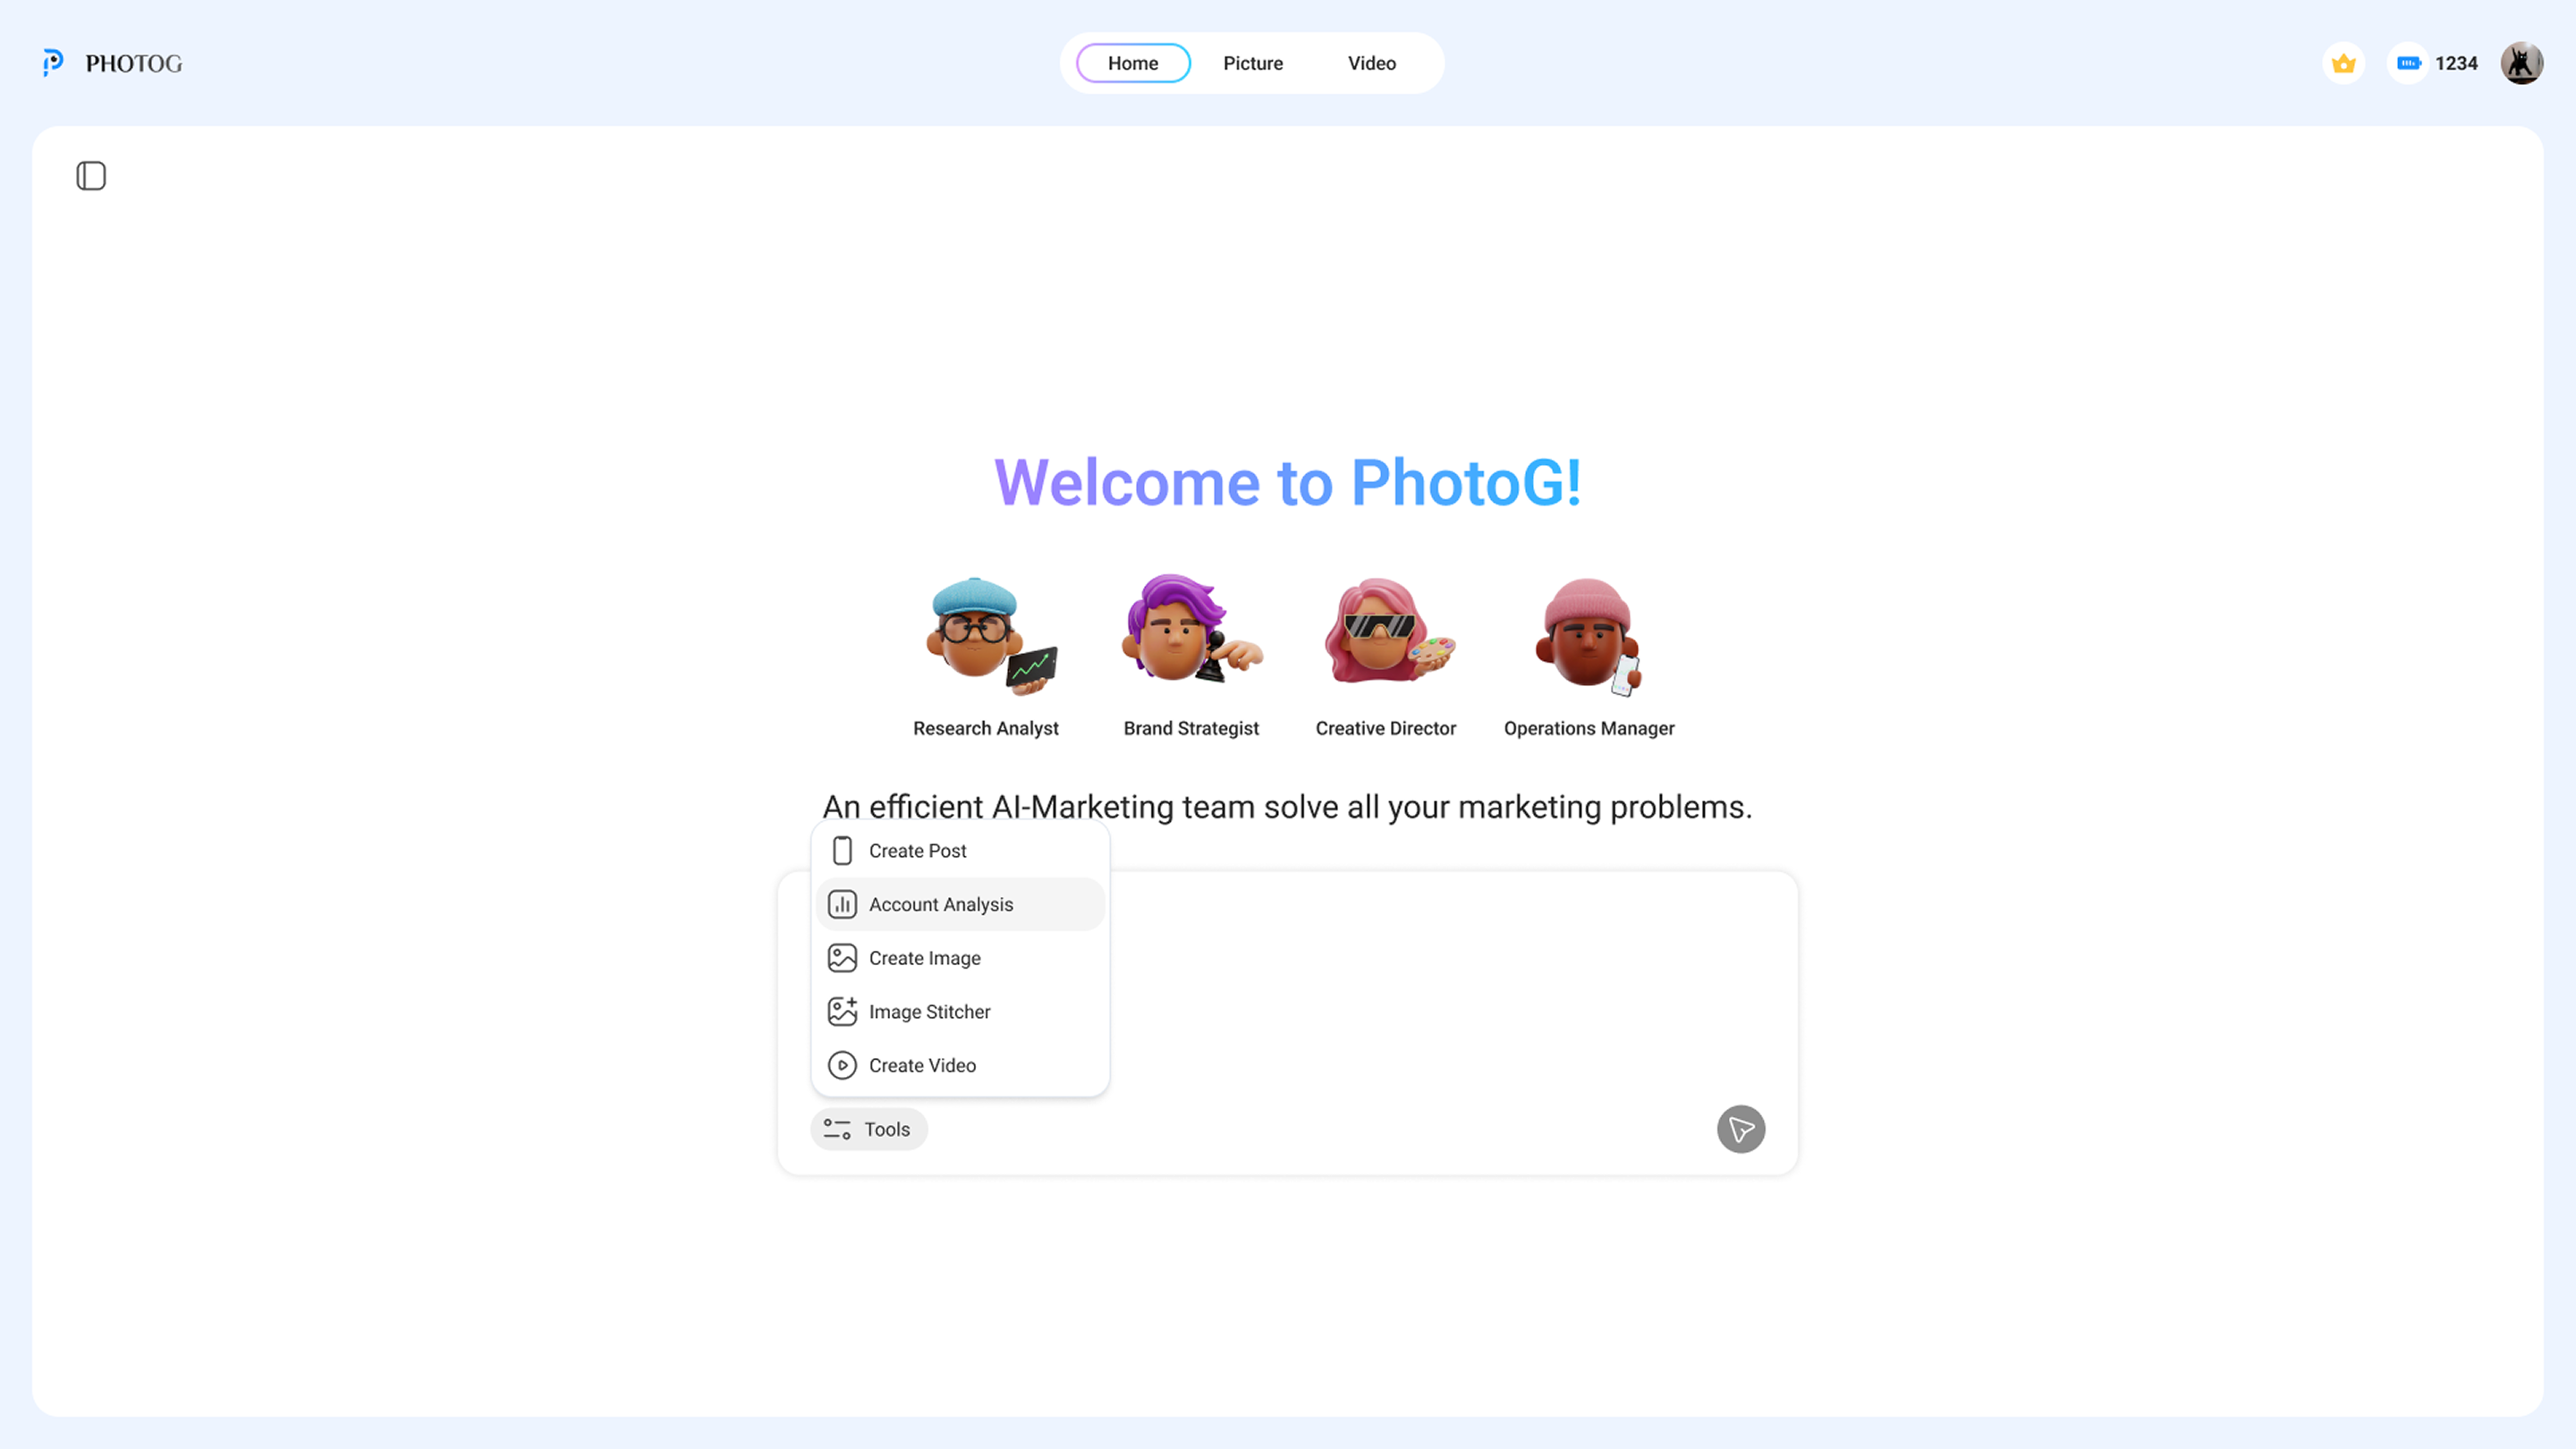
PhotoG is an agentic AI marketing platform for e-commerce brands. Users enter their product details, and four AI agents collaborate to deliver everything from industry analysis to a published social media post. A full marketing department, automated.
The product existed before I joined. It worked — technically. The agents could research, strategize, create, and publish. But most users left before publishing a single post.
I ran moderated sessions with beta users. The existing interface dumped everything — research, strategy, content — into one flat page. Four agents worked behind the scenes, but users couldn't tell who was doing what, where they were in the process, or how to give the AI better input.
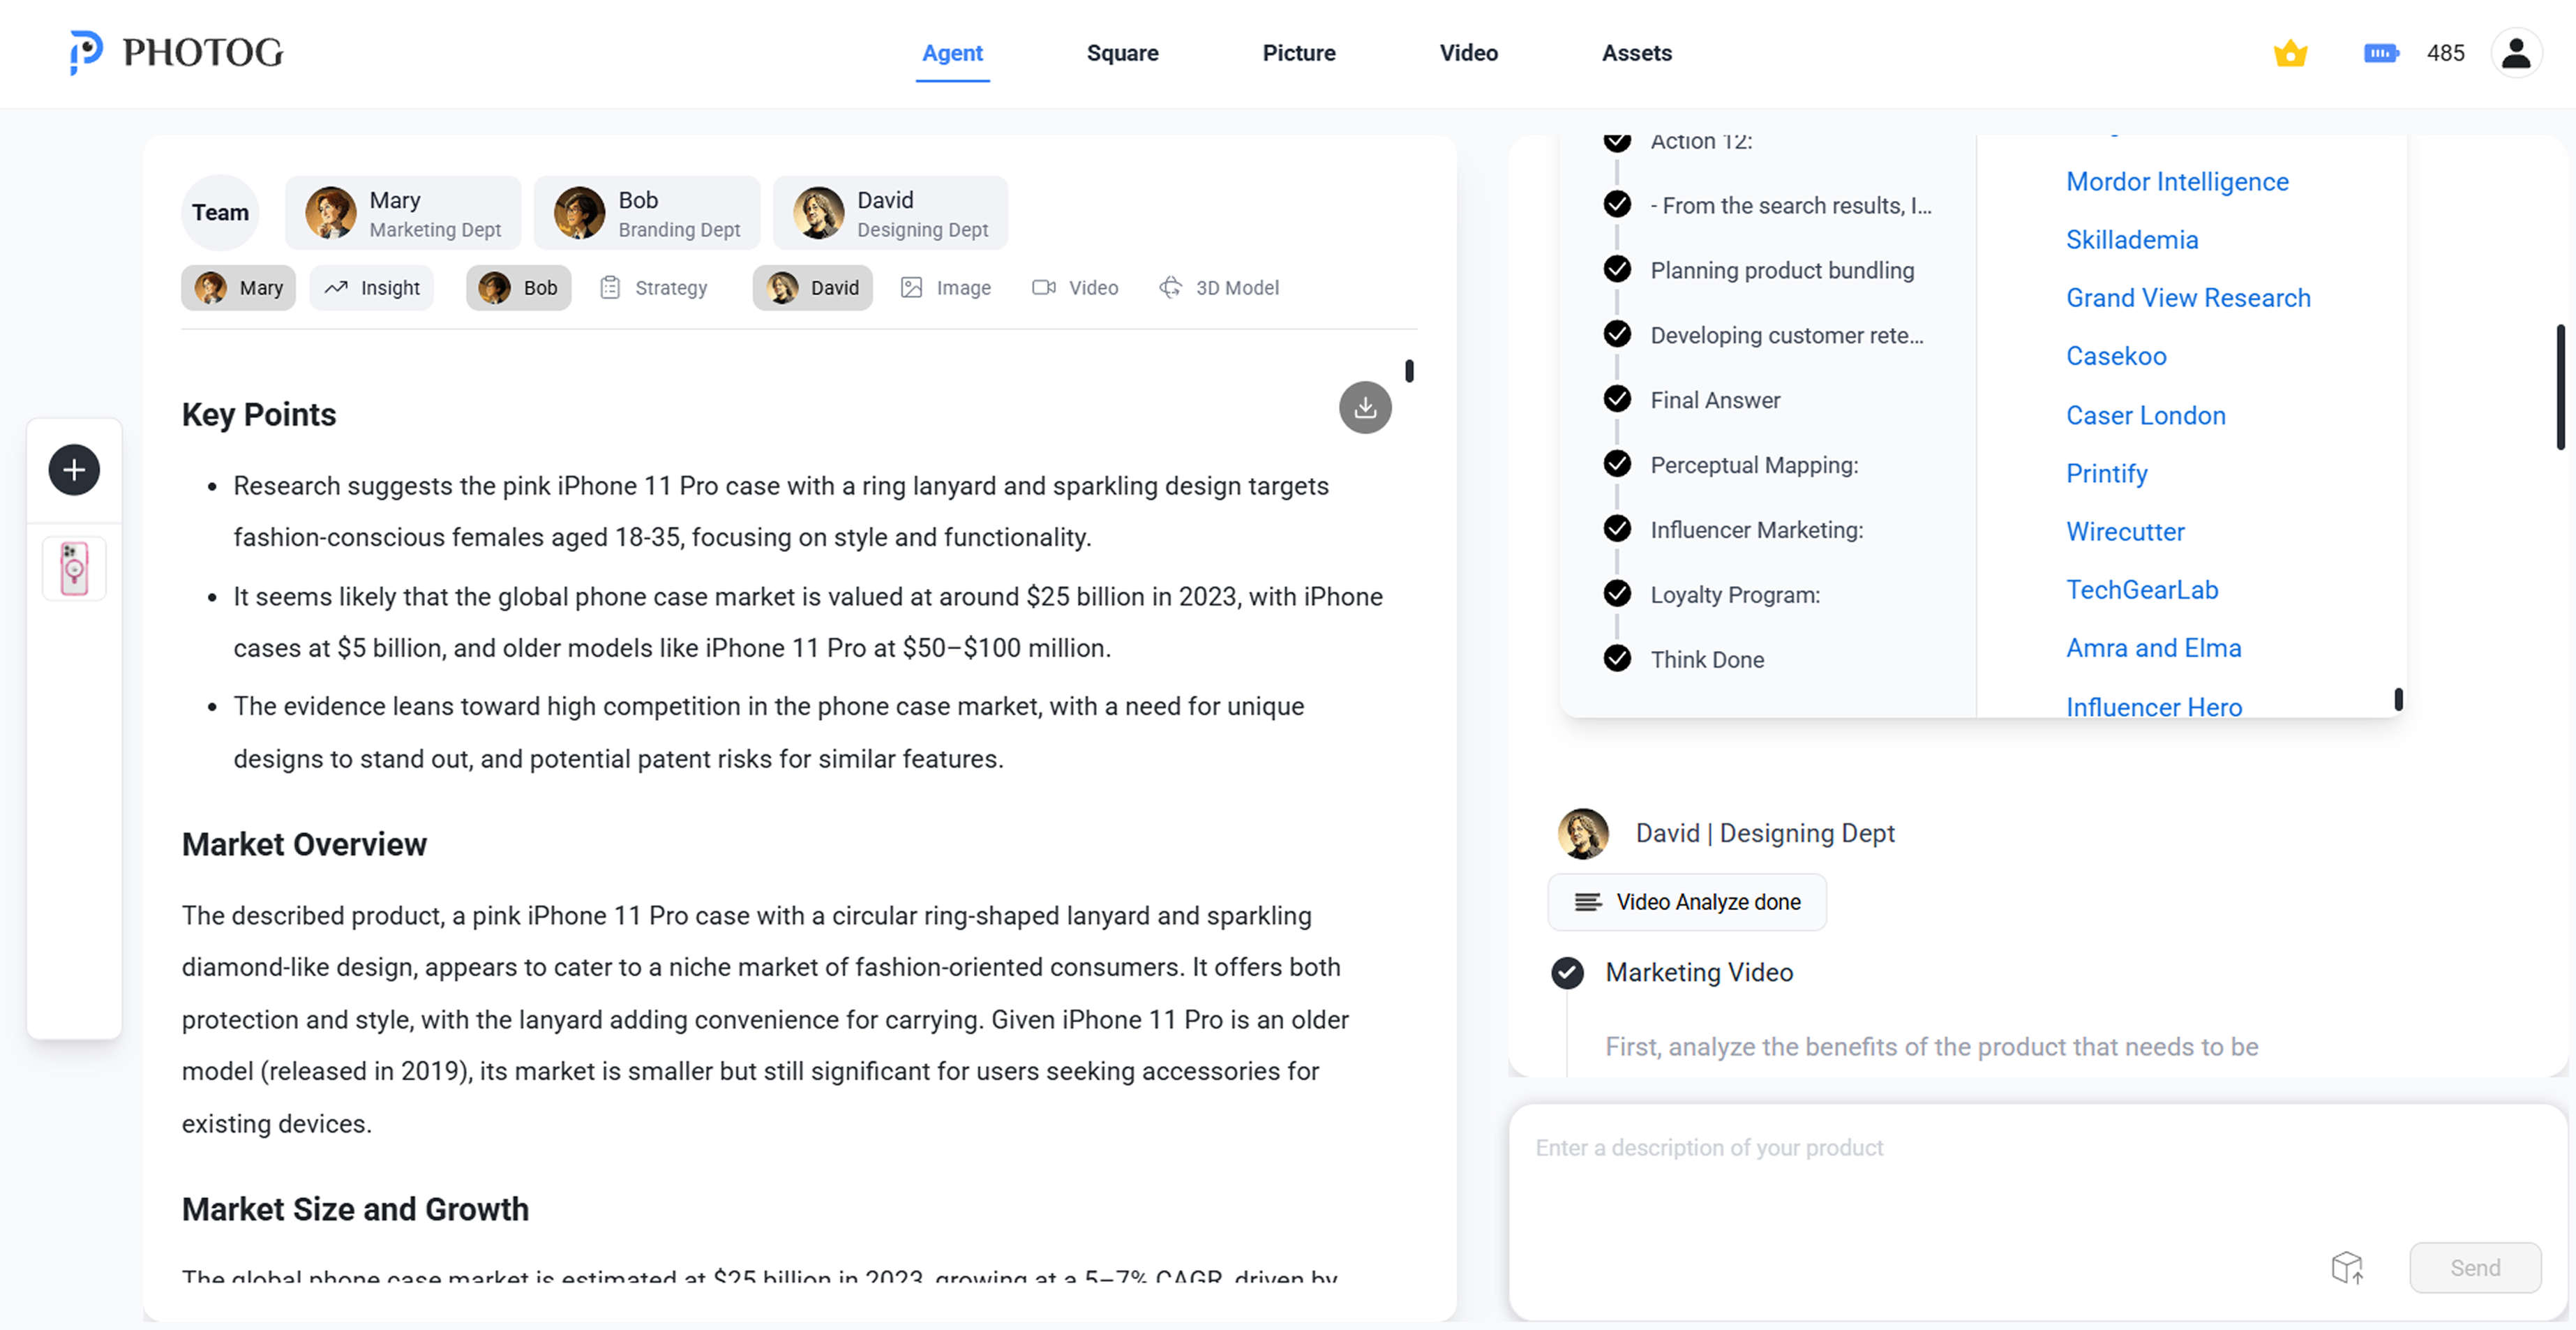
Research reports, market data, and strategy all rendered on one long scrolling page. No visual hierarchy between what four different agents produced.
Four AI agents worked behind the scenes, but the interface never showed who was doing what. Users saw output appear with no sense of process or progress.
The system moved from research to strategy to content automatically. No checkpoints, no approval gates. Users couldn't intervene or steer the output.
Most users were small e-commerce owners, not marketers. They didn't know how to describe their brand positioning or target audience. The system expected clear input but gave no help forming it.
Before PhotoG, I worked at an advertising agency designing marketing workflows for real clients. That experience taught me something: when clients pay for creative work, they want to be part of the process. They want to see options, give feedback, and feel ownership over the result. AI shouldn't be different — if users feel like passengers watching a machine make decisions for them, they leave.
I spent the first two weeks embedded with the engineering team, learning how each agent worked under the hood — what it could predict, where it hallucinated, how it handed off context between stages. Understanding the model's behavior shaped every design decision that followed.
Then I designed friction back into the system — deliberate pauses where users could review, edit, and decide before the next agent took over.
Three places AI showed up in how I built PhotoG, separate from the agentic AI that ships inside the product itself.
After each round of moderated testing, Claude clustered transcripts into the patterns that surfaced repeatedly — "I don't know what to type here," "where am I in the process," "is the AI done." Faster than re-watching recordings; cleaner than my notes.
I prototyped the three confirmation gates and the dual-panel layout in Cursor before committing them to Figma. Feeling the rhythm of three pauses in working code told me what mocks couldn't — the second gate needed less weight than the first.
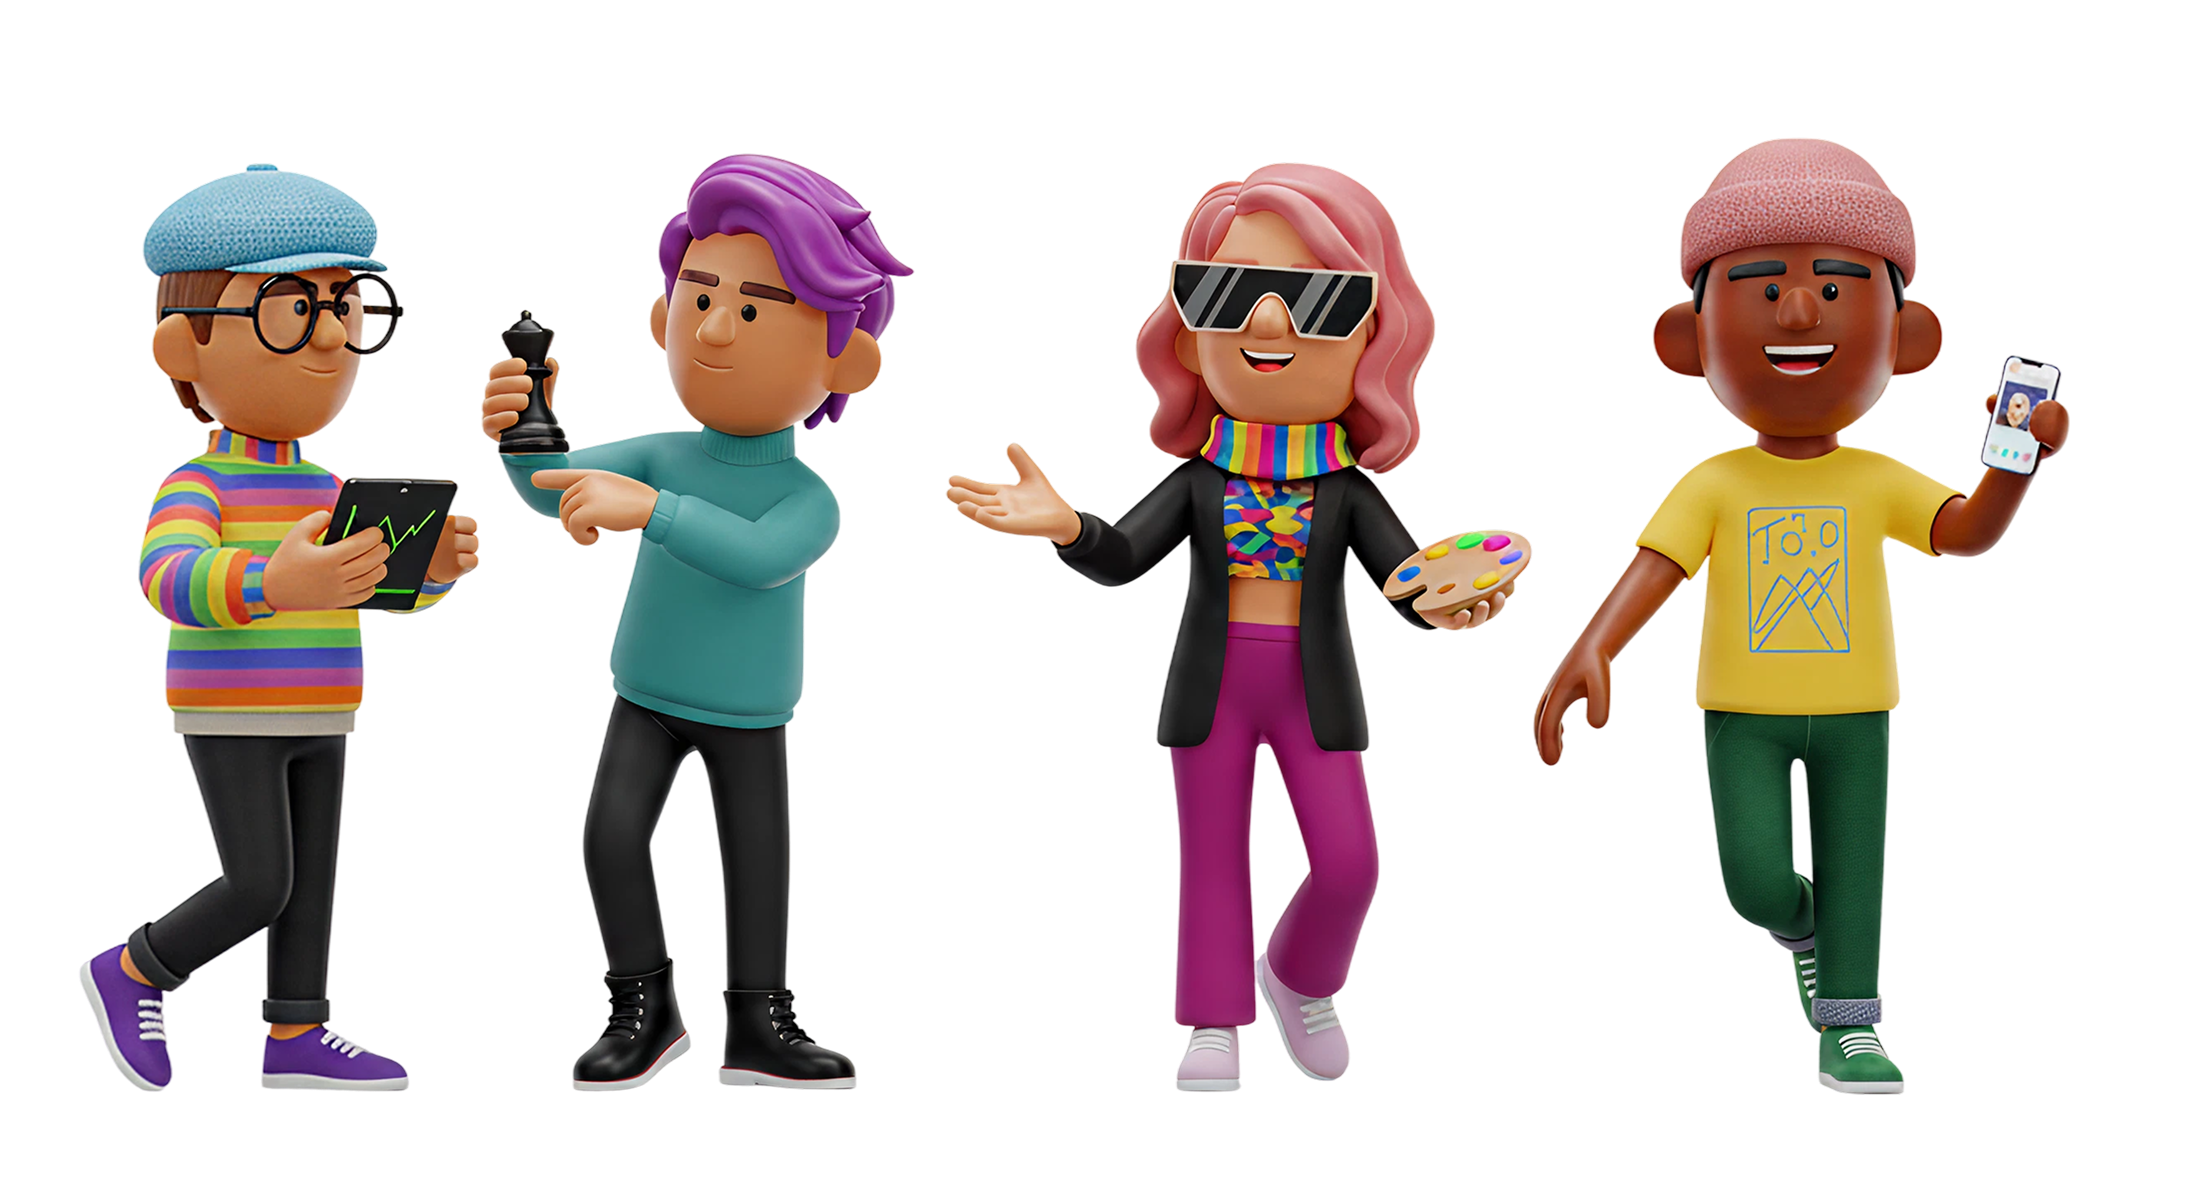
The four agent avatars were generated with AI image tools and art-directed against my visual brief. I designed the personalities and roles; the model produced the renders. Bridge between product design and brand identity at a speed I couldn't have illustrated by hand.
Mapped every step of the existing product across all five departments — user input, marketing, brand, design, and operations. Documented where users lost context, where the system auto-advanced without consent, and where output had no structure.
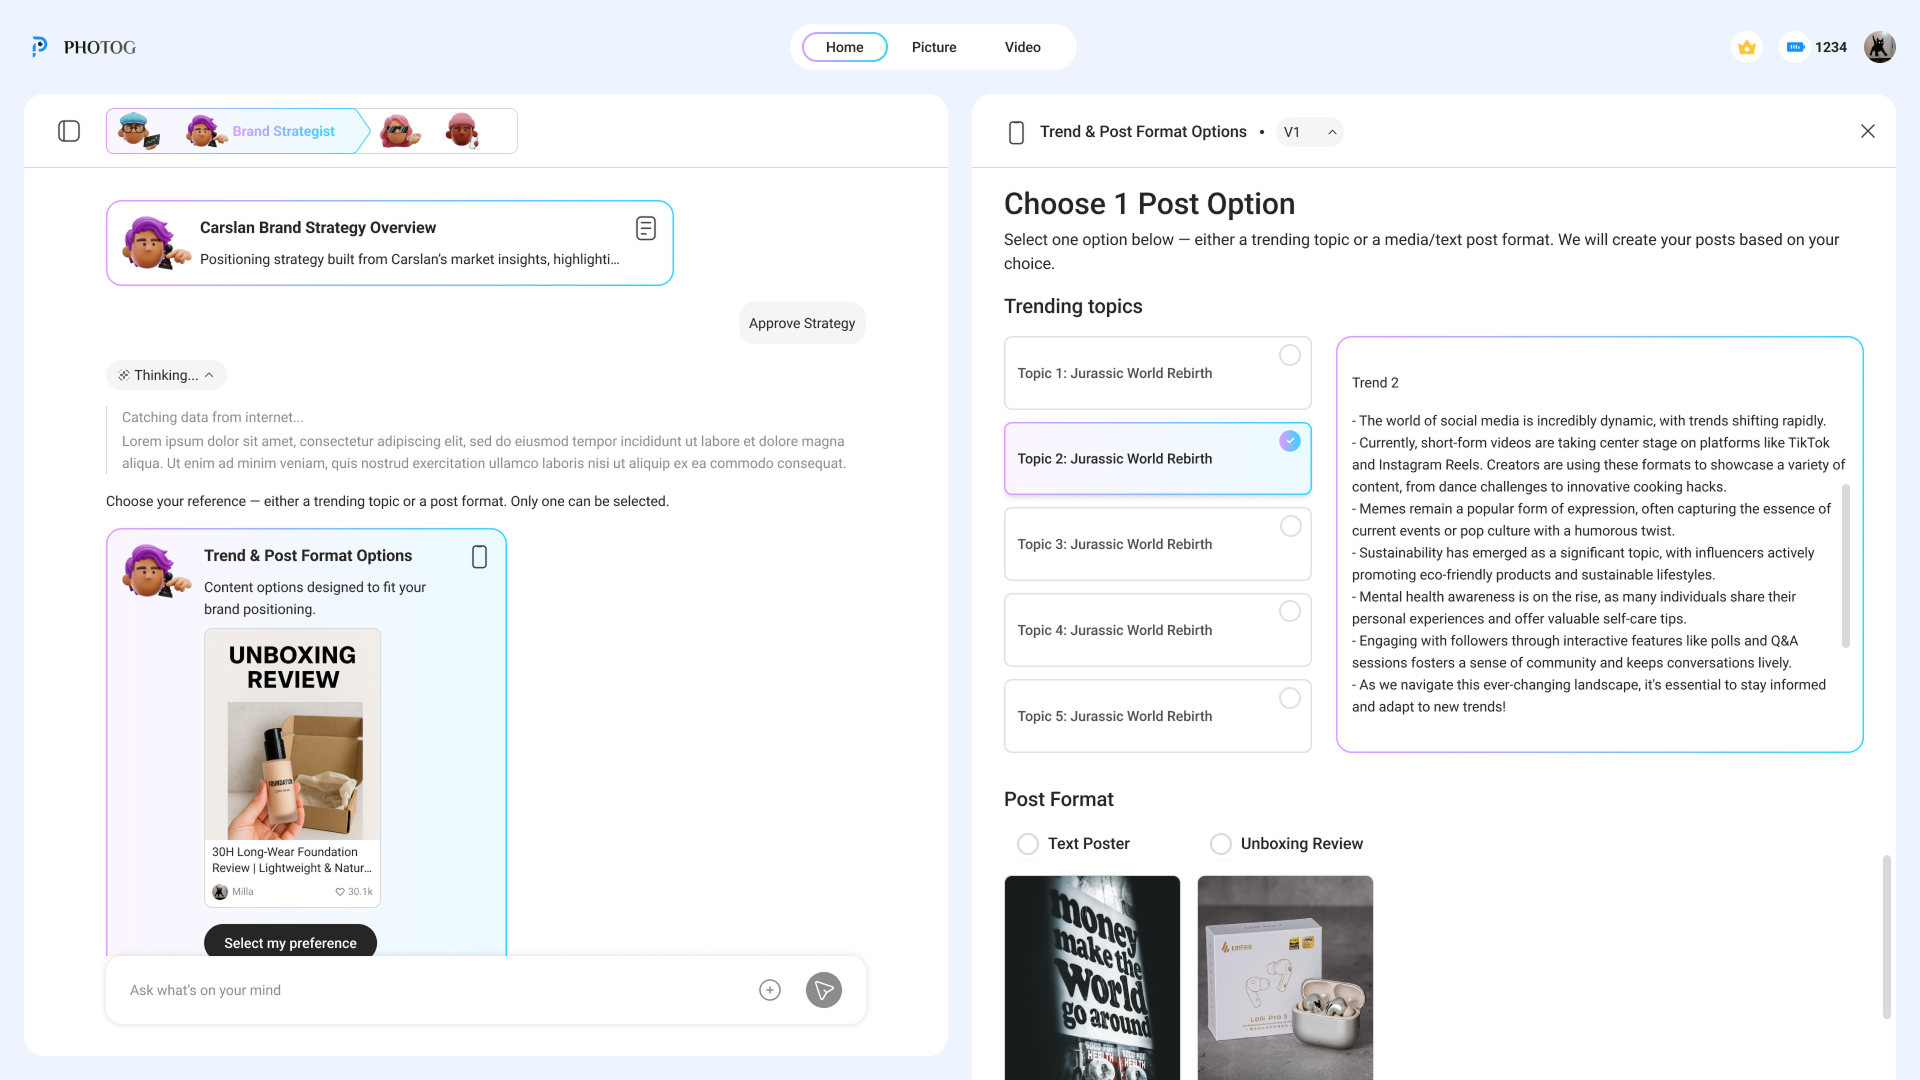
A confirmation step between every agent. Each gate shows what the agent produced, lets users edit it, and asks "Good?" before the next agent starts. Users can loop back at any point.
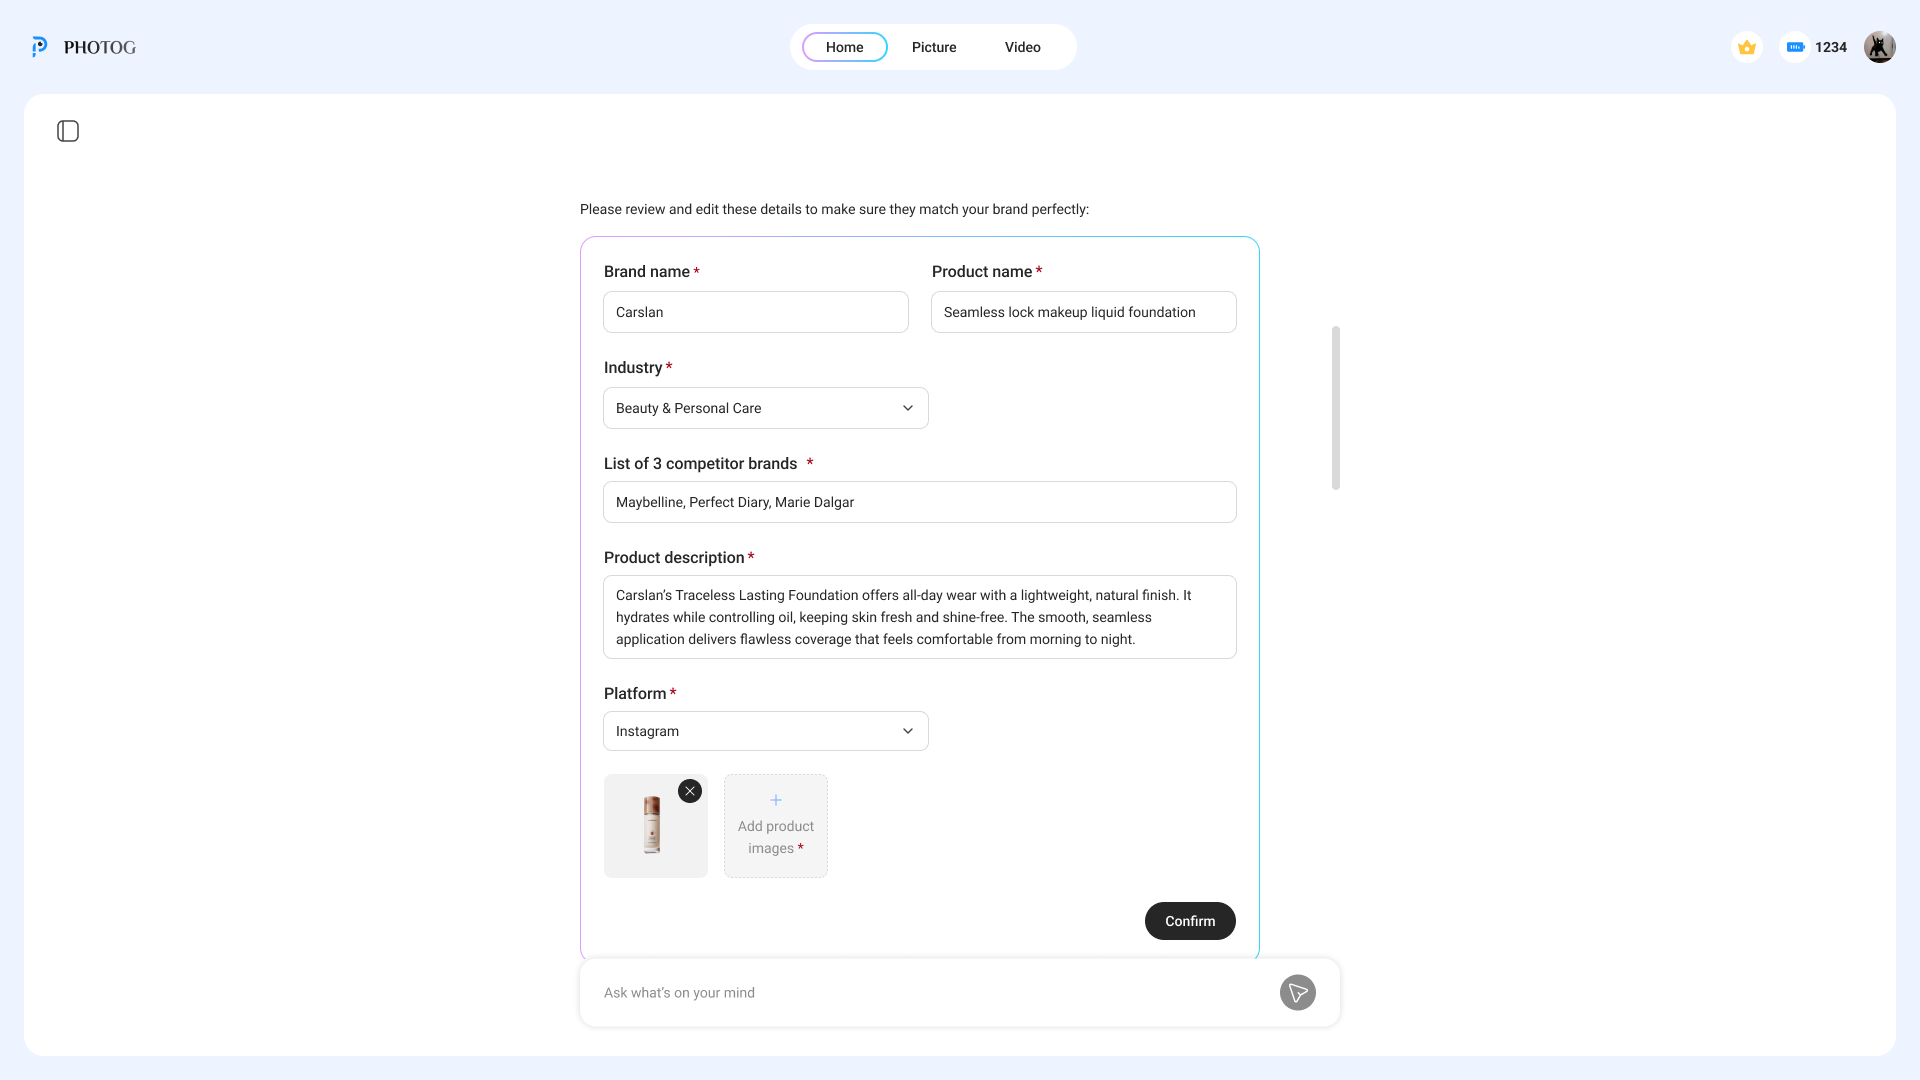
Most users weren't marketers — they didn't know how to describe brand positioning. I designed templates and structured prompts that helped users express what they wanted, so the AI had better input to work with.
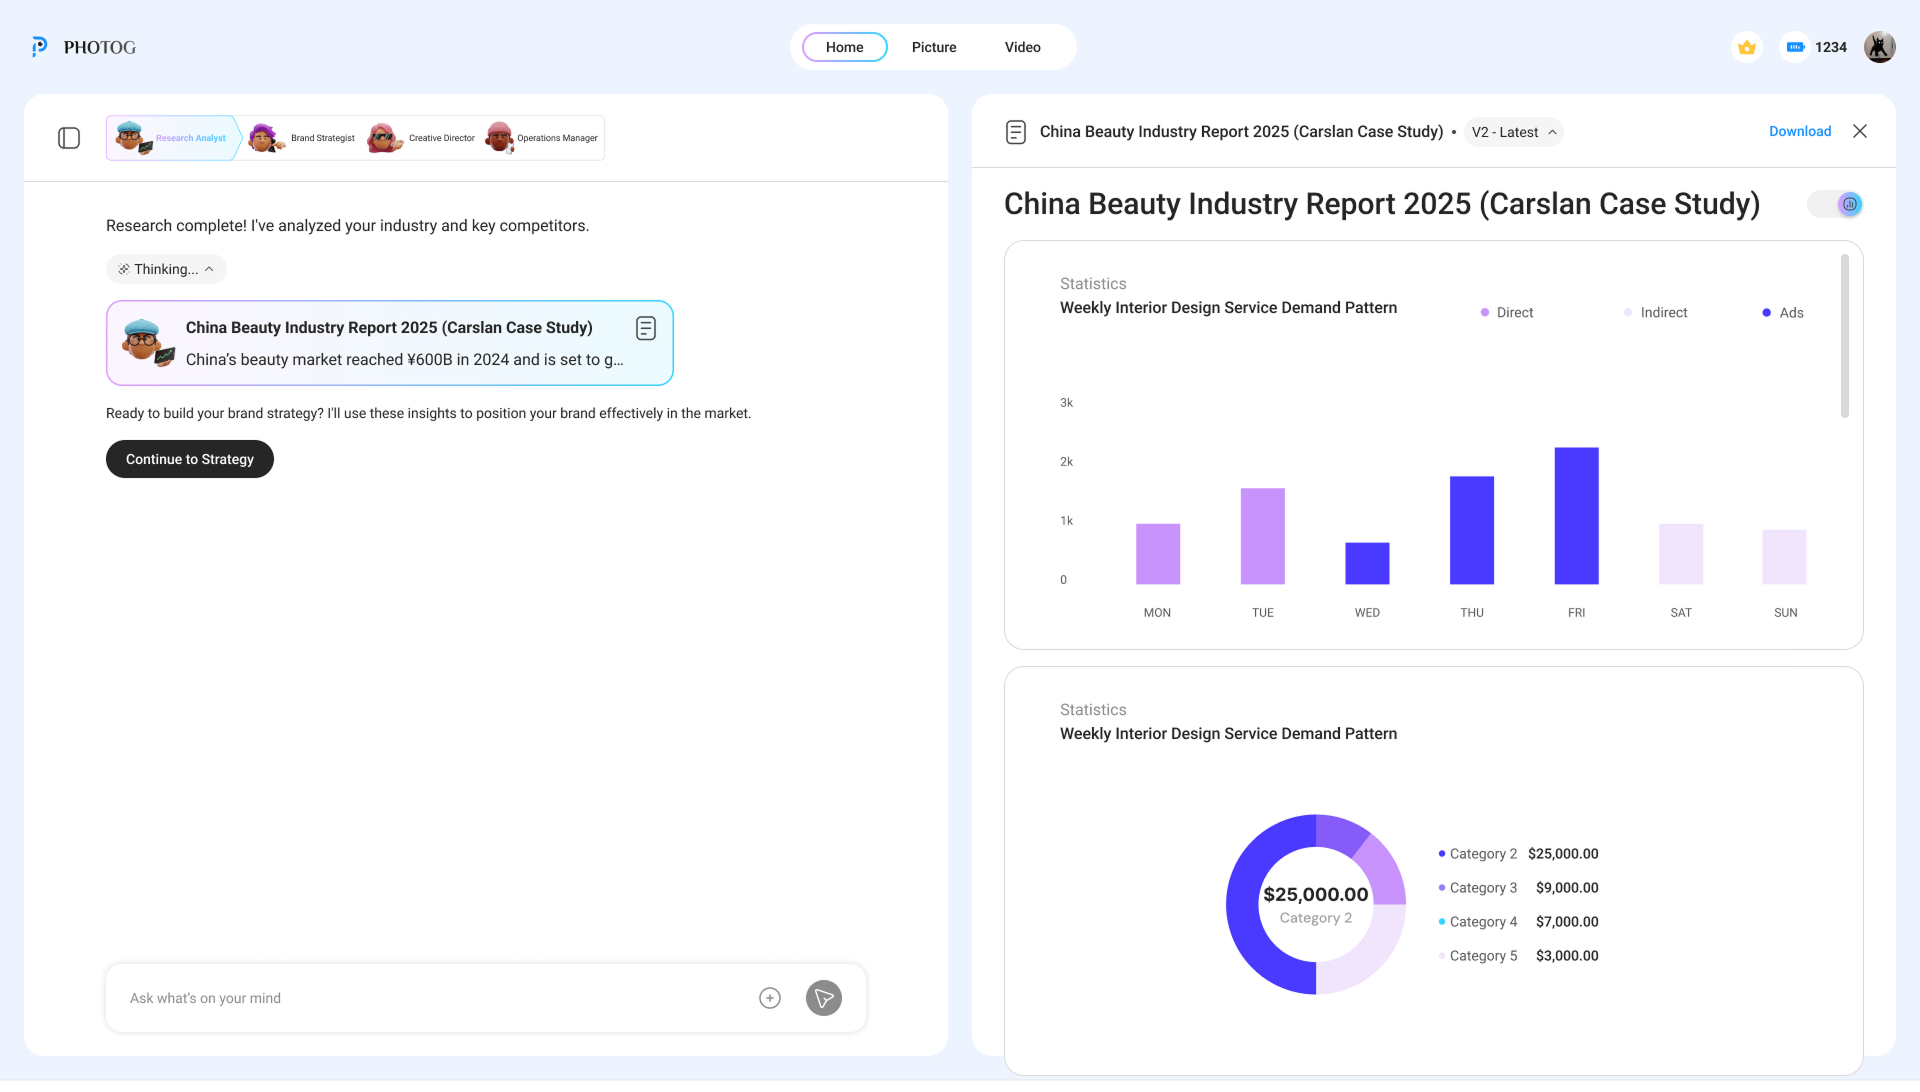
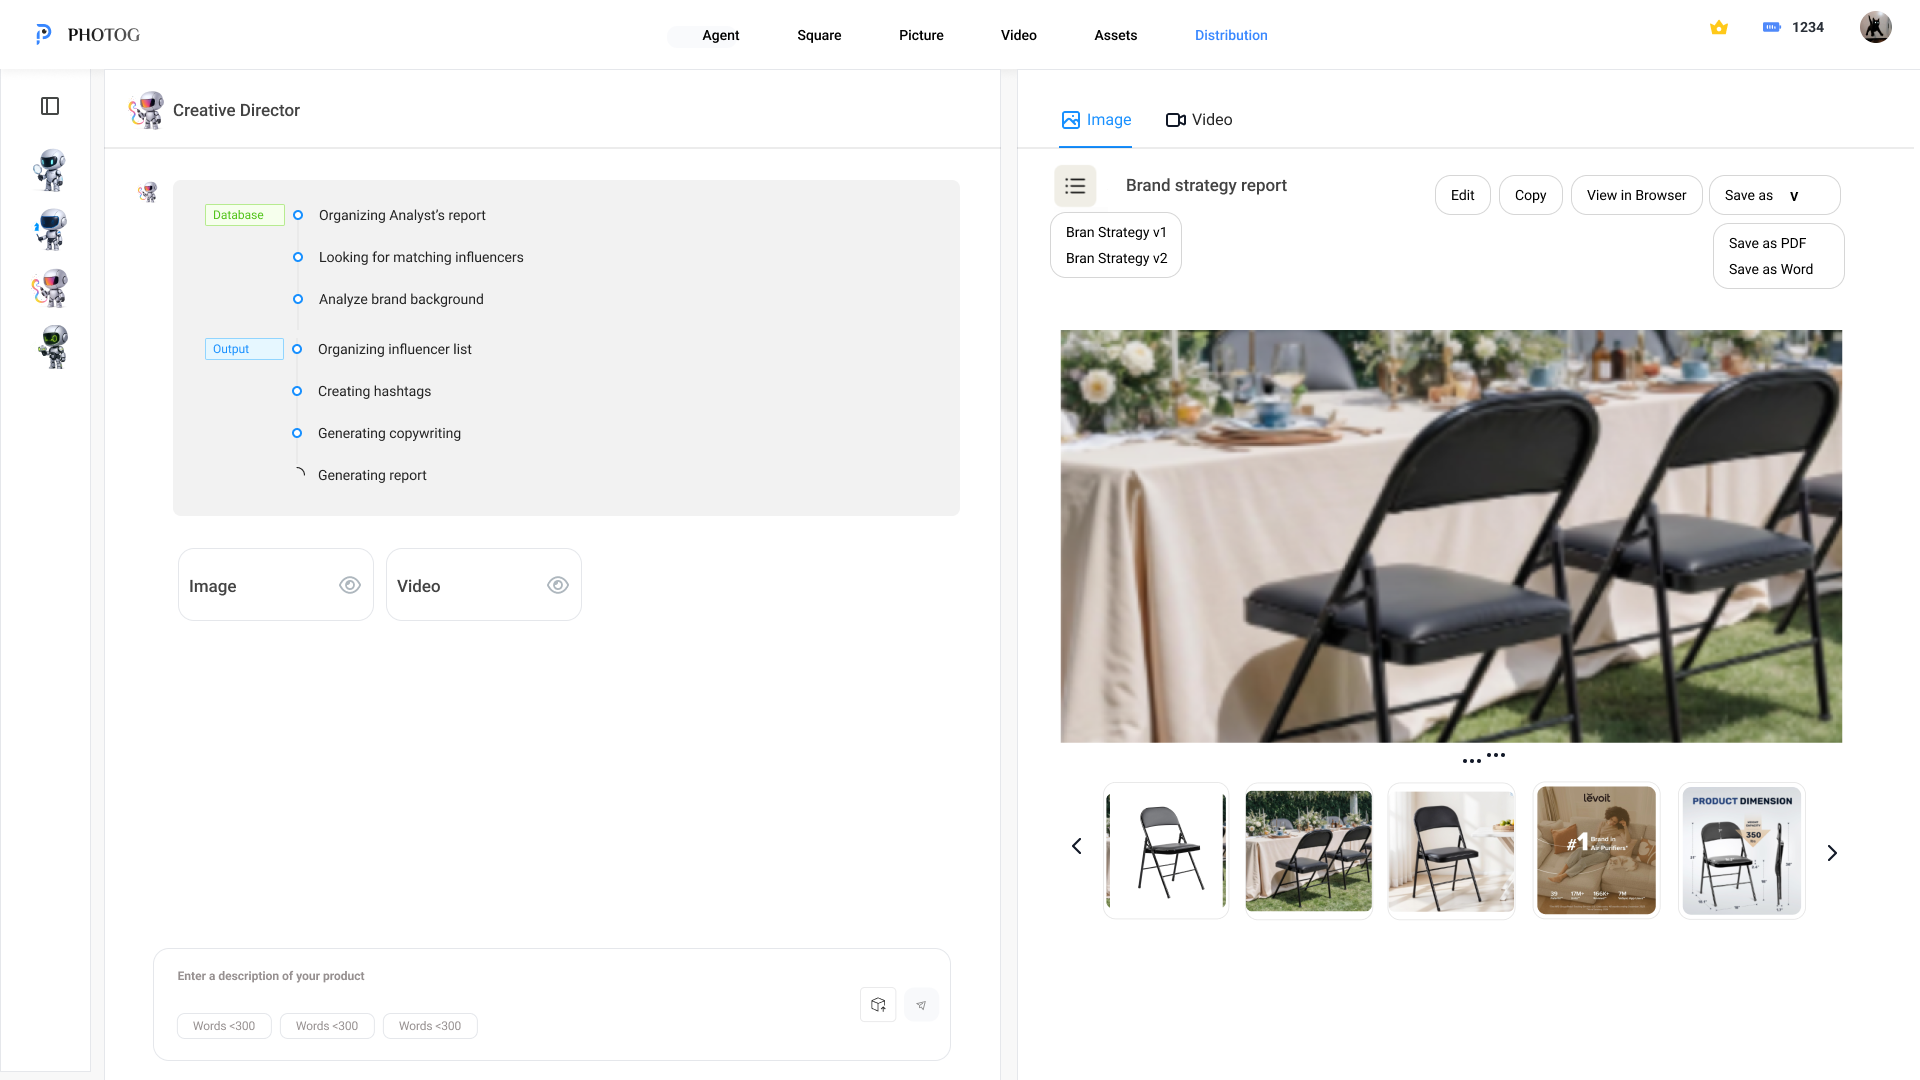
Left: ongoing conversation where users can ask questions and steer the AI at any point. Right: the editable deliverable. Users can intervene through chat, not just through gates.
The redesigned flow treats each agent as a chapter. You don't move to the next until you've reviewed what the current one produced — and made a conscious decision to proceed.
The intent preview shows what the next agent plans to do, what it needs from you, and what happens if you say no. Every transition requires a deliberate click — because the person needs a locus of control.
The conversational panel follows the AI's reasoning — the "why." The deliverable panel shows the output — the "what." Editable, downloadable, real.
My first iteration introduced the dual-panel concept and agent stepper — but usability sessions showed it still wasn't landing. So I iterated.
Introduced the dual-panel layout and agent visibility. But the flow still auto-advanced between agents — users could see what was happening, but couldn't steer it.
Added "Continue" gates between every agent transition. Users review each deliverable and make a conscious decision to proceed. The stepper, dual-panel, and gates work together as a trust system.
LLMs don't produce perfect results — they produce starting points. The old design treated AI output as a finished deliverable. The redesign treats every output as a draft that the user shapes into something they trust. Two correction paths run through the entire product: direct editing and natural language.
Every deliverable panel is fully editable. Users can rewrite copy, adjust data points, remove sections, or restructure the report — directly in the document, the same way they'd work in any editor. The AI produces the first draft; the user owns the final version.
The chat panel is always open alongside the deliverable. Users can tell the agent to change tone, focus on a different competitor, shorten a section, or regenerate with new constraints — without leaving the current stage. The agent revises in place.
The confirmation gate at each stage isn't just a "next" button. It's the moment where users decide: is this good enough to build on? If not, they edit, chat, or loop back. Nothing moves forward without a conscious decision.
If a later stage reveals a problem with earlier work — the strategy doesn't fit, the research missed a competitor — users can return to any previous stage, make changes, and let the downstream agents rebuild from the corrected foundation.
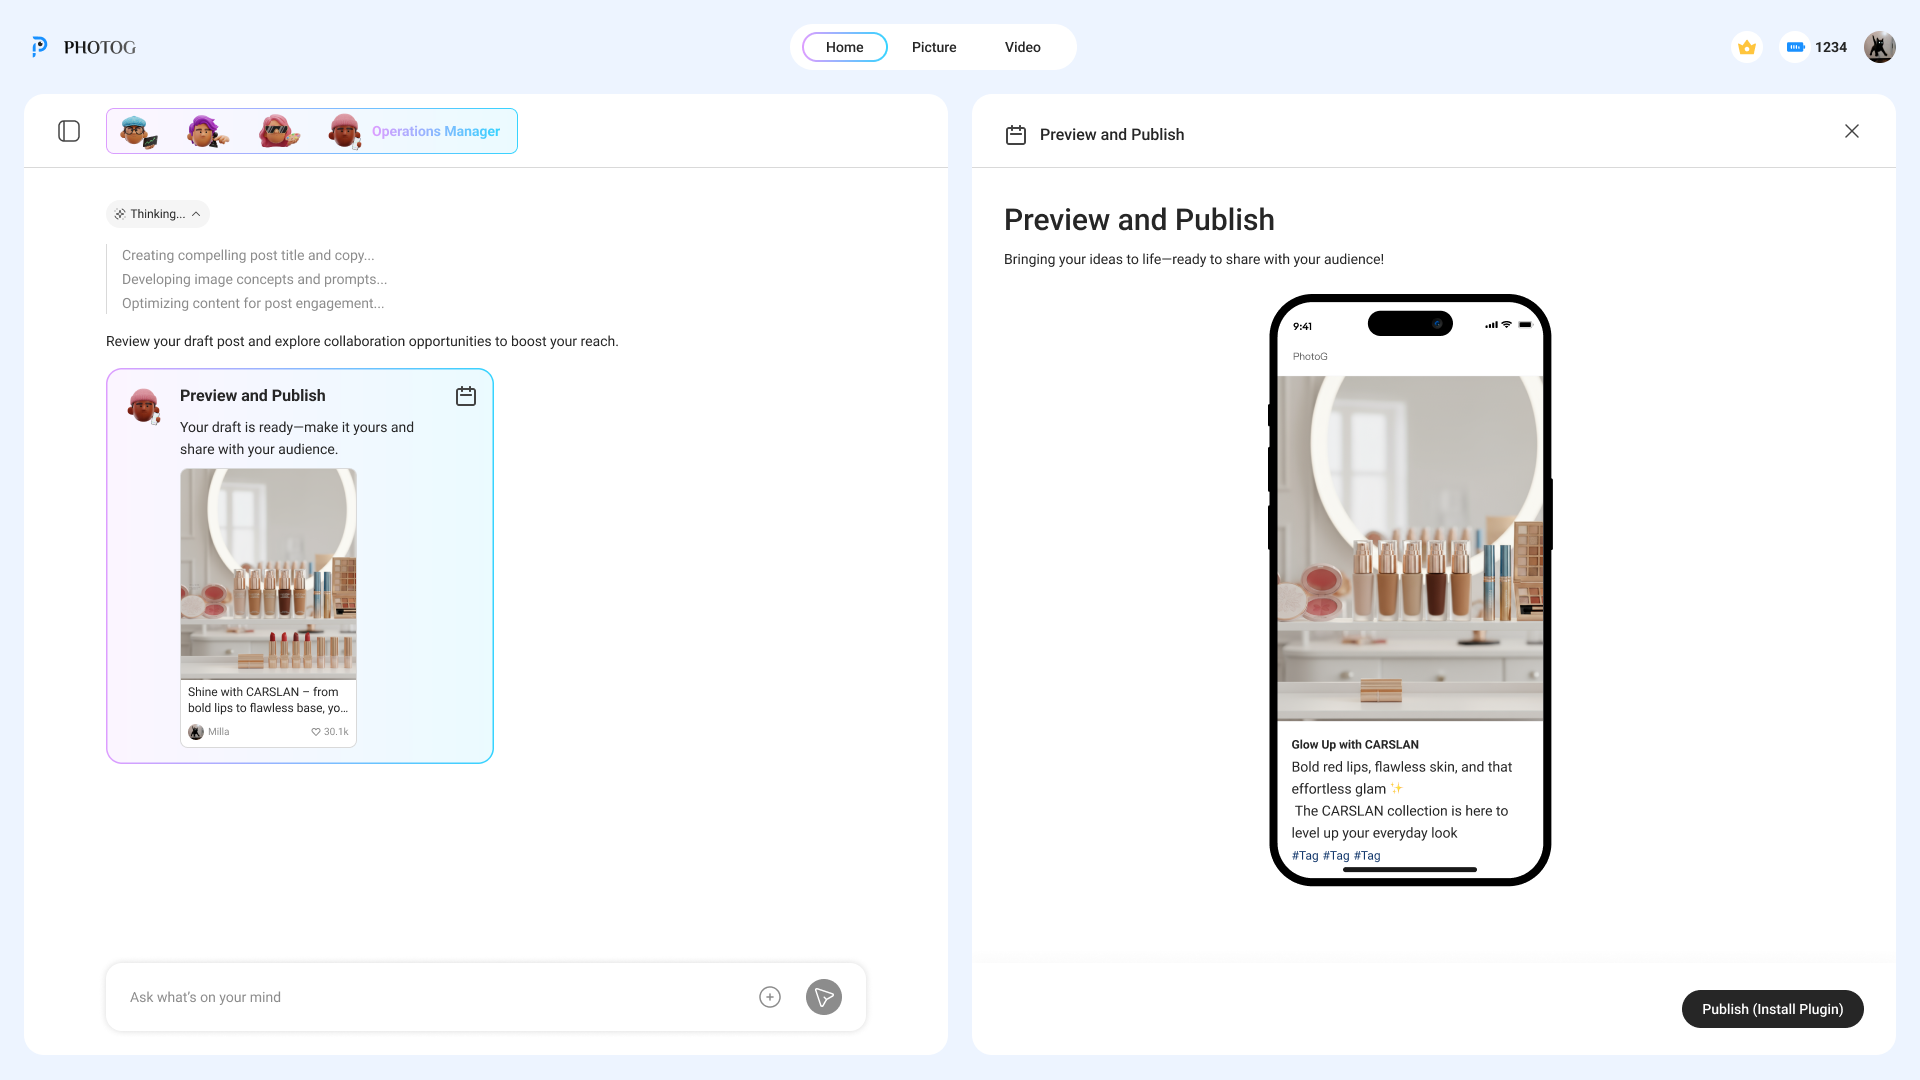
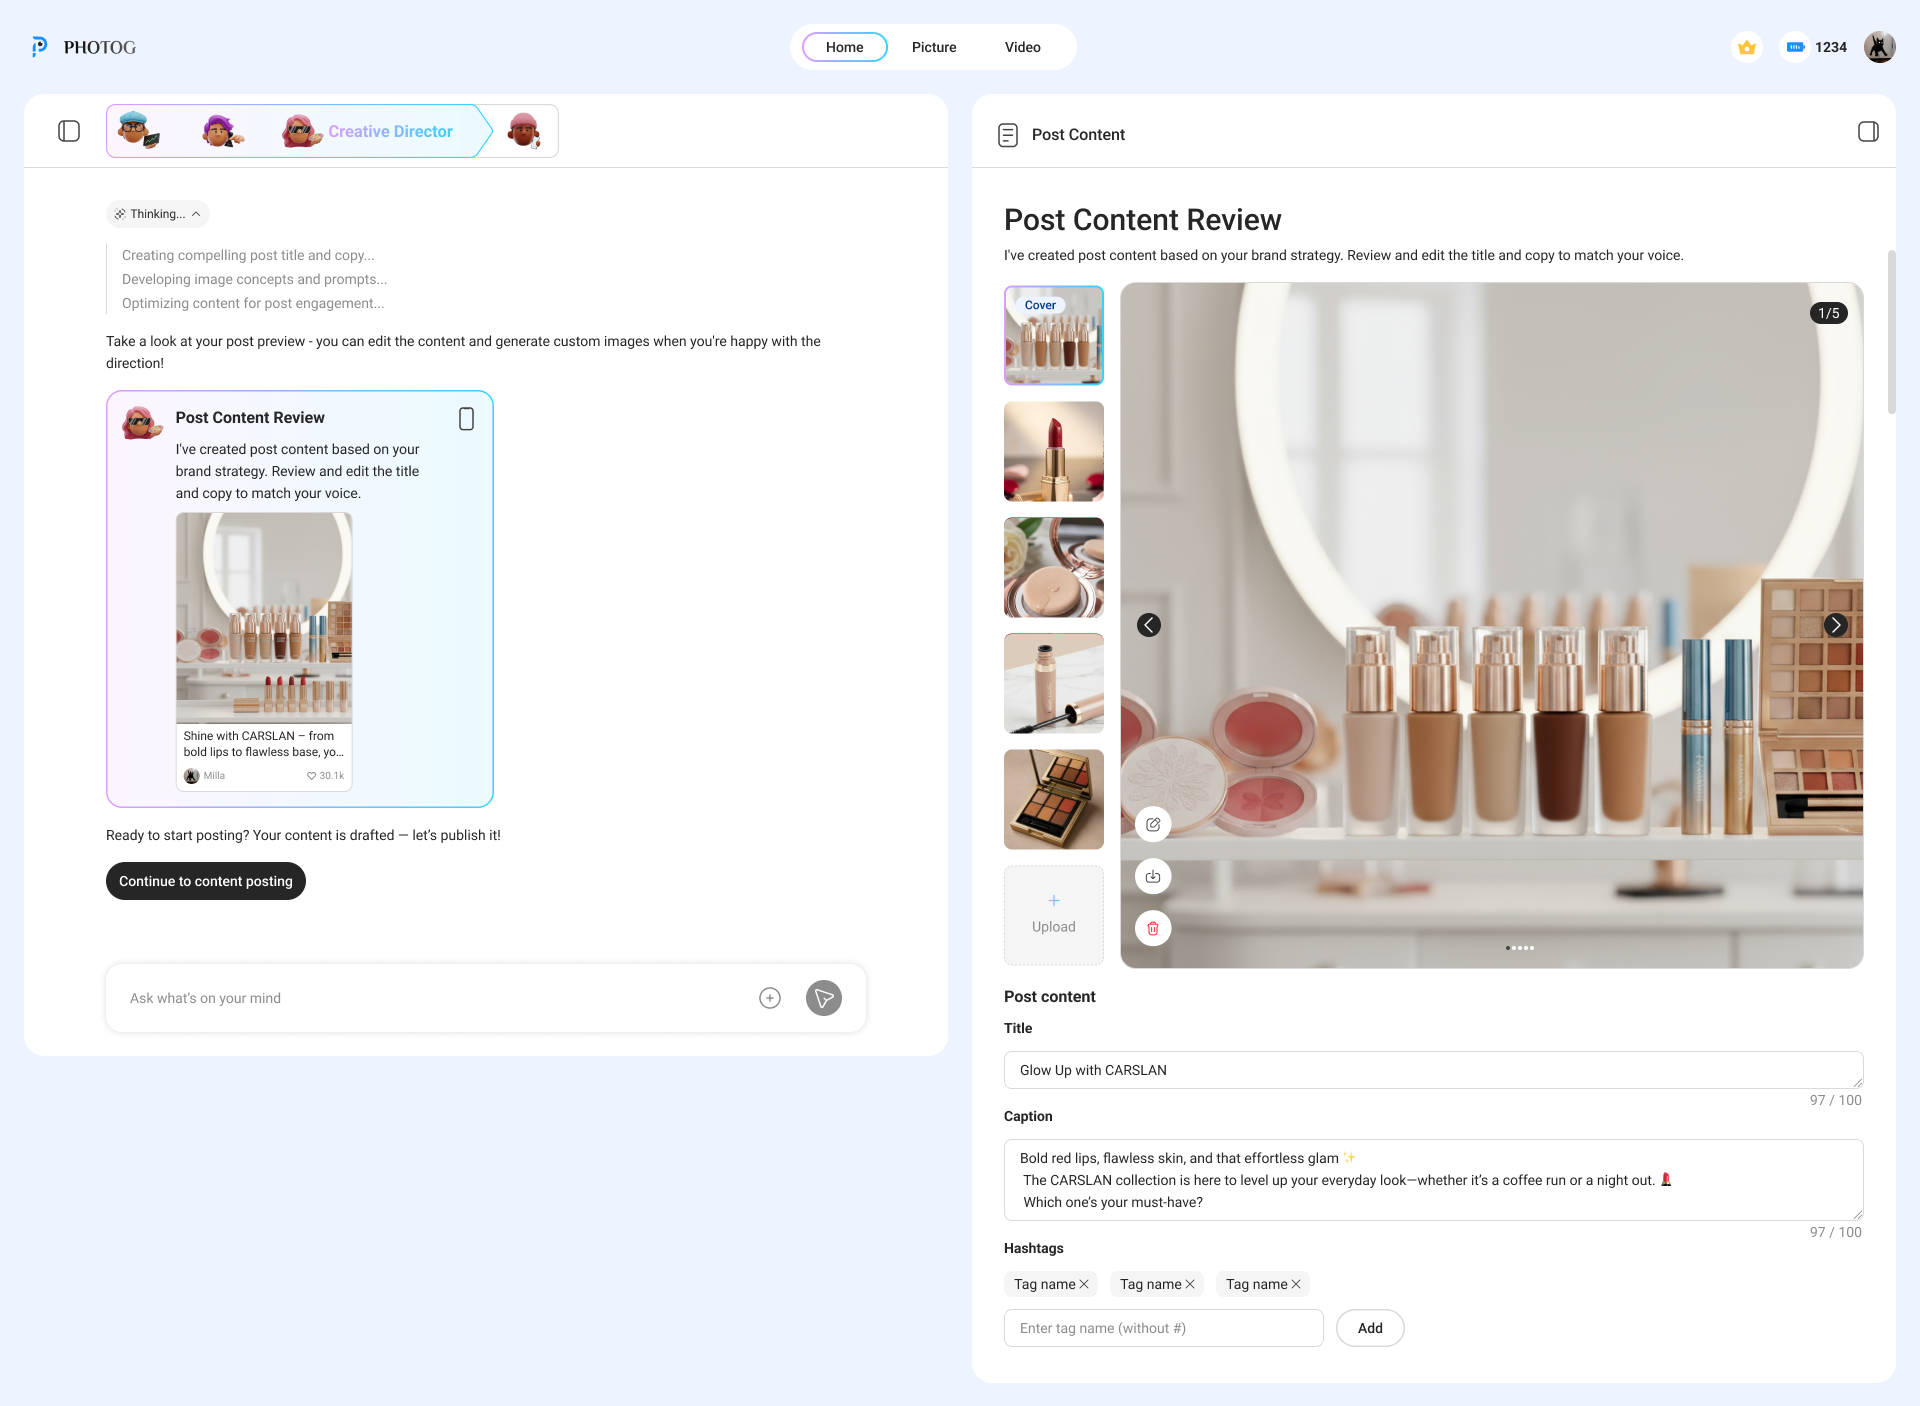
The Creative Director stage: AI generates the post copy, images, and hashtags — but every field is editable. Users rewrite the title, adjust the caption, swap images, or ask the agent to regenerate via chat on the left.
Two-person design collaboration. I owned the interaction architecture, established the design principles, and made the strategic case to stakeholders that slowing down the AI was the right call.
Defined the system model — stage-gate pattern, dual-panel layout, progressive disclosure hierarchy, and the confidence visualization framework. Worked with engineering on real-time agent state changes, WebSocket thinking indicators, and session persistence.
Three principles governed every decision: "Demonstrated value before delegation," "Autonomy boundaries at every transition," and "Confidence over speed." The hardest sell was convincing stakeholders that adding friction to an AI product was a feature. We shipped the full redesign in 8 weeks — and the three principles were cited in the company's Series A funding materials.
Designed the 3D character avatars for each AI agent. Concepted the personalities, art-directed the visual style, and generated the final characters using AI image tools. This bridged product design and brand — giving abstract agents a human-scale identity.
After launch, the platform scaled to production. Six months in:
The most impactful thing I designed was a pause — a moment where someone stops and thinks before continuing.
Users preferred watching the AI work step-by-step over getting instant results. Trust is built through accumulation, not assertion.
The confidence indicator, intent preview, and autonomy gate aren't UI components — they're contracts that define how humans and AI collaborate.
The hardest problems in AI aren't about making models smarter — they're about making smart models legible, controllable, and worthy of trust. That's a design problem.